Titanic: data analysis with Python Part 1/2
- 17. Feb. 2018
- 4 Min. Lesezeit
Would you have survived the titanic?
Let's try to answer that question by using machine learning, more specifically clustering algorithms.
The overall strategy employed will be to classify the passenger into different groups with unsupervised clustering. Then, for each group of passenger (also called cluster), we can determine the survival rate. Now, if you know to which group you would have belonged to, you would be able to predict your rate of survival.
I will be using Python and the Scikit-learn toolbox.
So first of all, what is in the titanic dataset? One easy way is to open it with pandas and display the first row:
Output:
Now let's create a dataframe where all irrelevant information is removed. Let's also remove all data that implicitly contain information about the survival such as "survived" or "body". We will also pre-process text data into numerical values. Instead of "male" and "female" for example, we will use 1 and 0.
Running this code gives us the following output:
Our dataset still contains some NaN (Not a Number) values. We will run preprocessing.Imputer() from Scikit-learn to handle those and chose a replacement by the most frequent value. This way, even if there are some unknowns about a passenger, we are still able to benefit from the partial information about that passenger while minimizing the bias by introducing makeshift data.
We will also standardize our dataset by centering every feature's data around 0 and give each feature the same variance. This can be done with preprocessing.scale and is particularly important for a classifier such as BDSCAN for instance.
Lastly, we will add survival information as well as the cluster labels to our work dataset and compute the survival rate of each group. Note that if the cluster label is -1 for a passenger, it basically implies that this passenger doesn't belong to any particular group.
Output:
Cluster groups: cluster, number of passenger, survival rate [False, 774, 51.679586563307495] [True, 82, 7.317073170731708] [True, 260, 12.307692307692308] [True, 41, 48.78048780487805] [True, 44, 13.636363636363637] [True, 21, 14.285714285714286] [True, 46, 58.69565217391305] [True, 41, 14.634146341463415]
So we have 8 groups in total.
The first group of 774 passengers, which is not identified as a cluster (value false) will have probably very varied and spread features. That group has about a 50% survival rate and is the default result. It doesn't mean that if you fall into the default group, you will have a 50-50 chance of survival. It really just means it could not identify some form of pattern or cluster of significant size within that group. If you were to randomly pick a passenger of that group, you would have a 50-50 chance of survival. But if you are a 3rd class 90 years old passenger, I really don't think that you'd have a 50% chance of survival...
The group with the least chance of survival is the second group. If you shared the characteristics of that group, the odds would clearly be pretty much against you with only 7% survival rate.
Then we have groups 3, 5, 6 and 8 which have comparable survival rates ranging from 12 to 15%.
Group 4 gives us a similar survival rate to the default group. The main different between group 1 of 774 passengers and this group, is that if you belonged to that group, you are clearly part of a cluster sharing similar characteristics and you would very likely have about 49% chances of surviving.
Group 7 shows better chances of survival with nearly 60% survival rate.
For the purpose of this post, we will now plot graphs with information about group 2 and 7 to try and make sense of this result:
Output:
Legend:
Group 2 Plot (82 passengers part of a cluster with 7.3% survival rate):
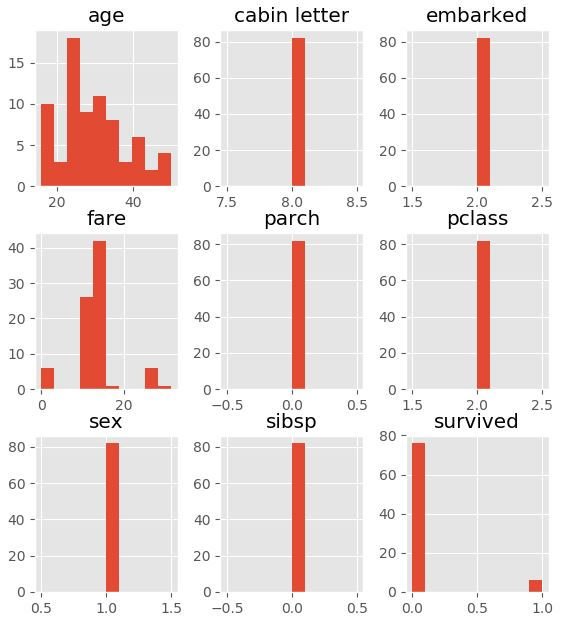
This group is a cluster of 2nd class male passengers with ages ranging roughly between 20 and 40. All of them embarked in Southampton, had no spouse, siblings, parents or children on the ship and payed around 14 British Pounds for their journey. Only 5 survived...
Group 7 plot (46 passengers, part of a cluster with 58.7% survival rate):
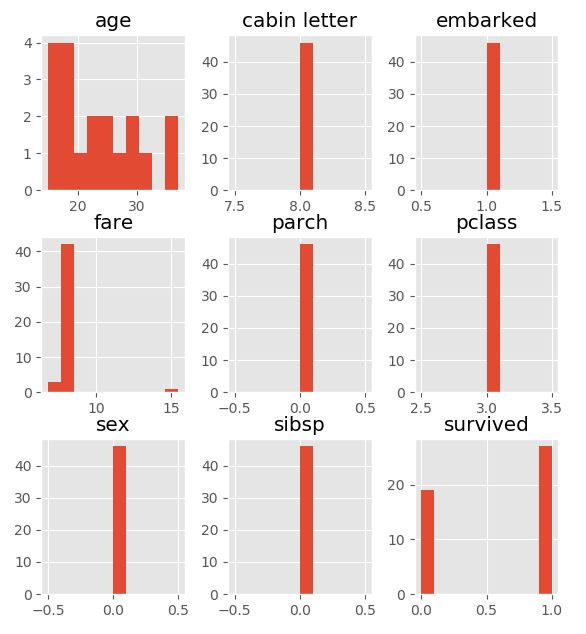
This cluster with almost 60% survival rate is composed of 3rd class female passengers ranging from teenage girls to mid 35 years old women. All of them embarked in Q which is Queenstown, had no parents, spouses, children or siblings onboard and payed about 8 British Pounds for their ticket.
Conclusion
What is really interesting about this approach, is that the algorithm wasn't specifically trained to group those passengers according to their survival rate. It is just regrouping passengers with similar characteristics. Once those groups have been identified, properties can be associated with them, such as the survival rate. After training, it is possible to predict to which group a passenger would have belonged to. All that is required is to pass the features such as age, ticket fare, number of parents and children on board etc... to the function predict().
While interesting, this method has it's limitations. It doesn't really allow us to answer the question "Would you have survived" in a satisfying manner. About half of the passengers were part of a default group. Also, it is very likely that age plays a role and is not being accounted for in this prediction. A more effective way to predict the survival chance on this rather small dataset would be to use supervised machine learning with a support vector machine. This is the topic of the next post.


Kommentare